
With all the uncertainty in the current market environment, it is natural for investors to seek out familiar indicators guiding them toward what to expect next. The recent yield curve inversion is a tempting barometer for predicting where we are in the economic cycle. However, there are factors currently influencing the shape of the curve that require additional consideration in judging its reliability as a recession predictor.
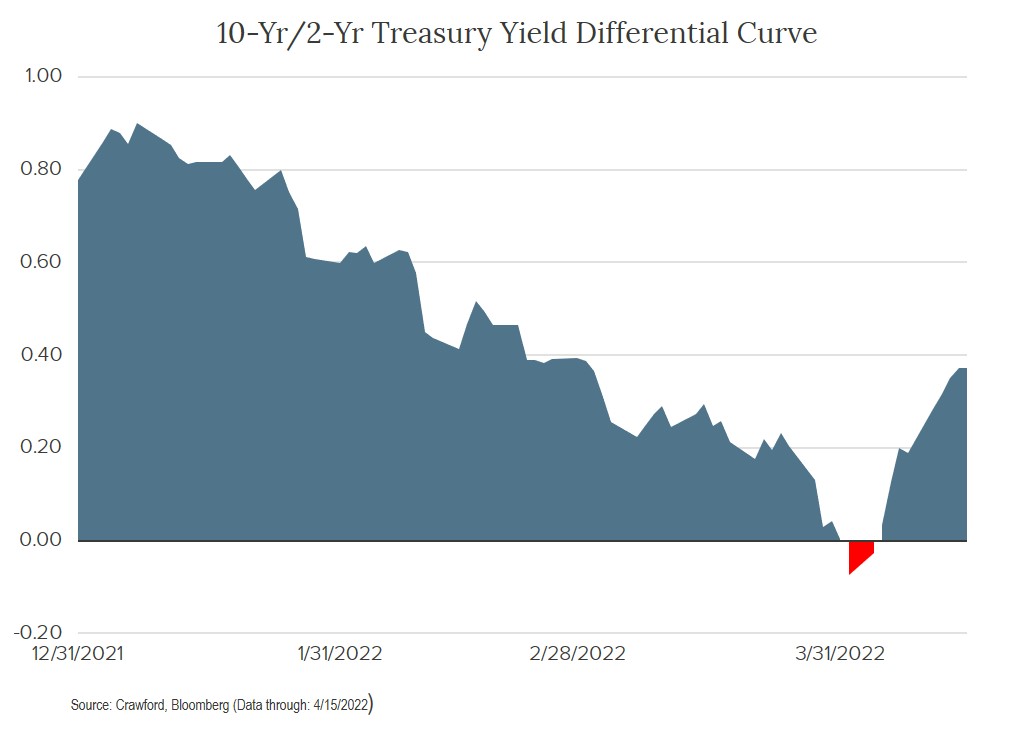
The “yield curve” is commonly defined as the difference in yield between the 10-year and 2-year Treasury note. A flat or inverted yield curve occurs when the 2-year yield is equal to or higher than the 10-year yield. Historically, this indicates the economy is in a late cycle stage and the Fed has pushed interest rate policy beyond the neutral rate (defined as inflation expectations + ~0.50%). Surpassing the neutral rate negatively affects economic growth as demand fades, supply-side slack is generated, and a negative feedback loop drags the economy into recession. It is difficult to believe we are late in the economic cycle now given it is less than 2 years old. It is also hard to imagine the Fed has moved policy beyond the neutral rate with only one 25 basis point rate increase in the books, and expected inflation over the next 10 years (as measured by Treasury Inflation Protected Securities "TIPs" Breakevens) currently 2.91%. This would suggest that the Fed funds target rate would currently have to exceed 3.41% to be considered above the neutral rate.
To understand why the yield curve inverted, we must consider the components driving interest rates at various points along the curve. Nominal Treasury yields are composed of 1) real yields, and 2) inflation expectations (as measured by Breakeven rates). [For a more detailed discussion of yield components, please see "Are Bond Investors Being Compensated for Inflation."] The current nominal yield curve is dominated by an inverted inflation expectations curve where 2-year inflation Breakevens (BE’s) are ~4.42%, and 10-year BE's are ~2.91%. This has the effect of propping up front-end nominal yields when combined with very low real yields, which are more directly influenced by Fed policy. The net effect of combining elevated BE’s and artificially low real yields produced the recent inversion.
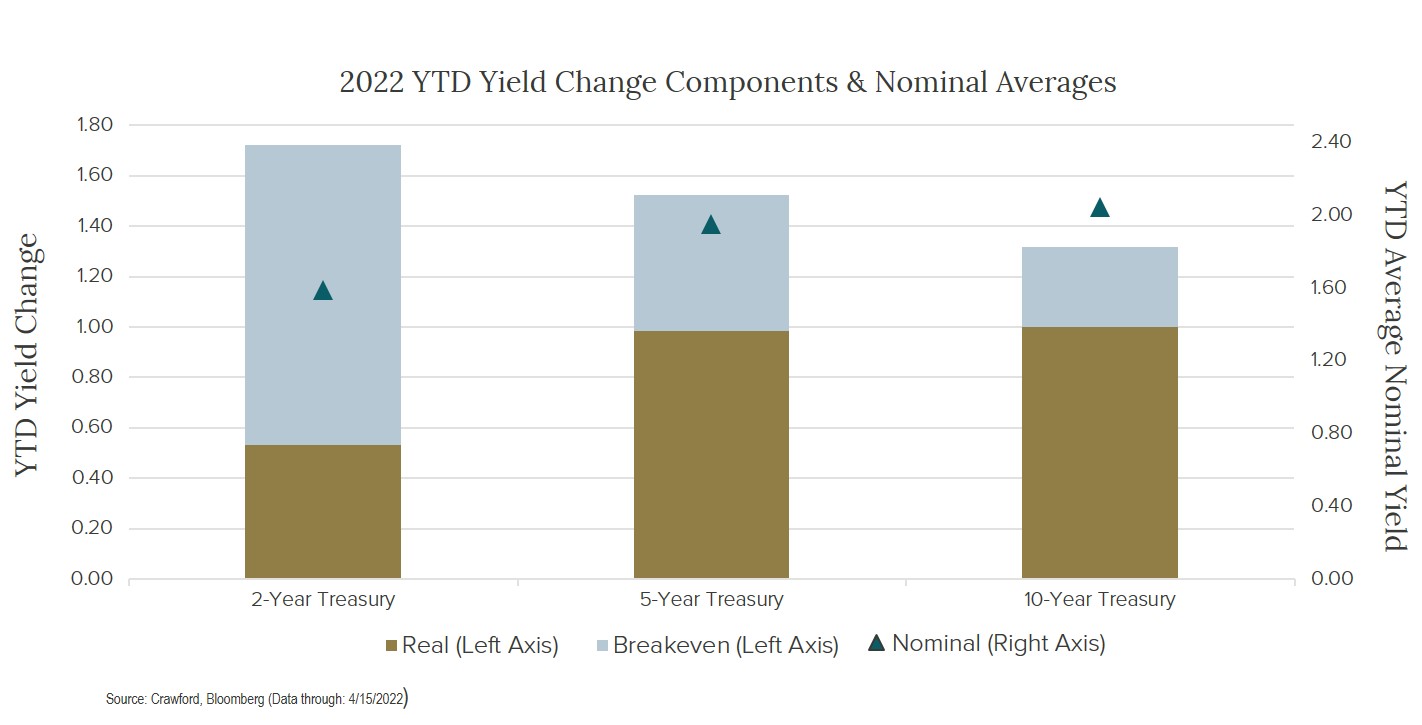
Knowing what contributed to the recent curve inversion leads us to contemplate what may change the shape of the curve going forward. When the Fed tightens policy, BE’s decline as the market judges the risk of inflation to be lower, and real yields move higher. Given recent communications from the Fed regarding their intent to increase the Fed funds rate and reduce its balance sheet, we expect real yields to move higher and inflation expectations to decline, particularly on the front-end of the curve.
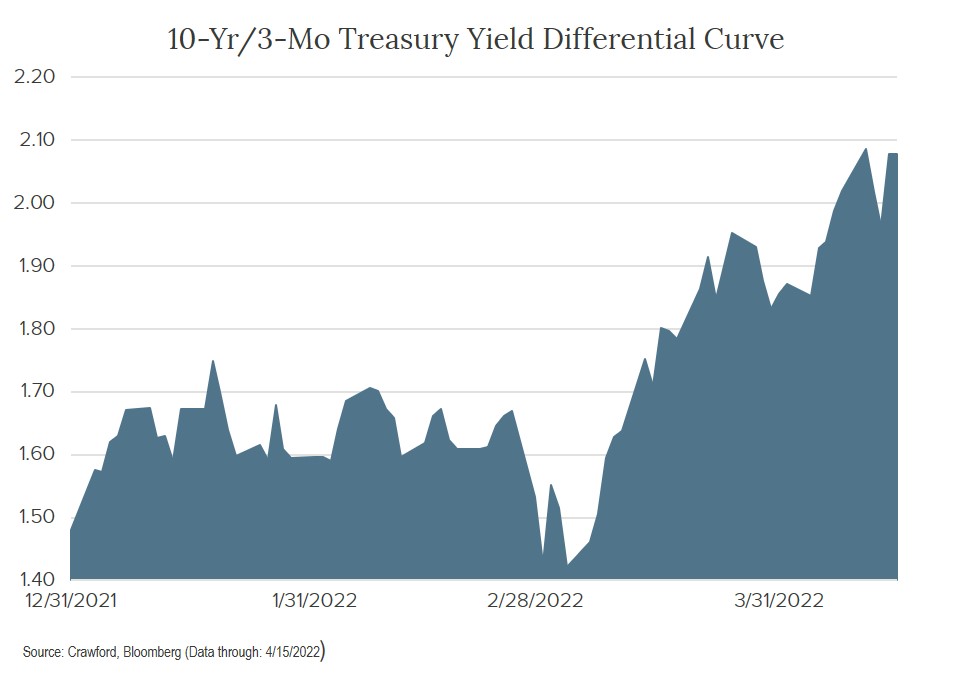
We believe a better proxy for the yield curve, particularly in the context of current influences, is the yield differential between the 3-month Treasury bill and 10-year Treasury note. As illustrated in the graph below, that relationship remains steep indicating we are early in the economic and interest rate cycle. It is worth noting the Fed prefers this relationship in gauging the yield curve.
We do not wholly dismiss the significance of the recent yield curve inversion. However, we are mindful of the factors contributing to it, and remain intentional about considering the bigger picture in terms of other indicators warning us of recession risk, including: sustained corporate profit margin compression, rising jobless claims, and generally deteriorating employment statistics.
Disclosures:
Crawford Investment Counsel (“Crawford”) is an independent investment adviser registered under the Investment Advisers Act of 1940, as amended. Registration does not imply a certain level of skill or training. More information about Crawford Investment Counsel, including our investment strategies, fees and objectives, can be found in our Form ADV Part 2, which is available upon request.
Crawford reserves the right to modify its current investment strategies and techniques based on changing market dynamics or client needs.
The investment strategy or strategies discussed may not be suitable for all investors. Investors must make their own decisions based on their specific investment objectives and financial circumstances.
CRA-22-118

Is Your Portfolio Ready for Winter?
Currently, there is a dramatic shift occurring in the global financial markets. Unlike a fantasy novel, it is not as definitive as the first snowfall.

Reaching for Yield and Landing in Failure
We will continue to evaluate our bank holdings on an individual basis with a keen eye on managing overall risk.

The Rising Importance of Dividend Yield
We are likely moving from a period of above-average investment returns from stocks and bonds to a more normalized or lower return environment.
