
Background
According to well-known price change measures, like CPI (the Consumer Price Index) and PCE (the Personal Consumption Expenditures deflator), U.S. Inflation data recently reached levels last observed in the early 1980’s.
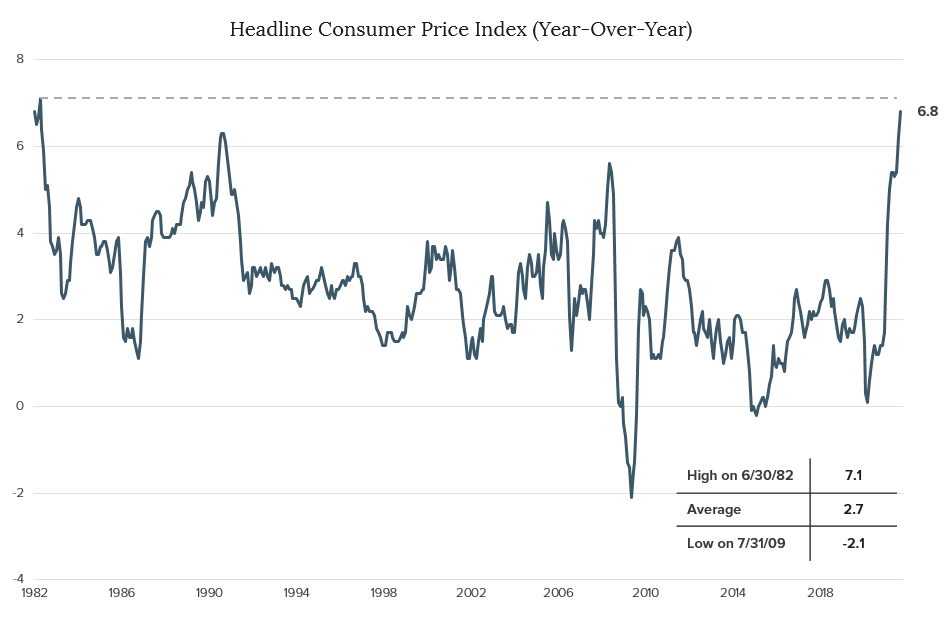
Source: Bloomberg (Data through: 11/30/2021)
The threat of continued high inflation is dominating news headlines and economic conversation, as evidenced by recent Congressional testimony where Federal Reserve Chairman, Jerome Powell, stated “…the threat of persistently higher inflation has grown.” This bourgeoning inflation anxiety has many bond investors concerned about being adequately compensated in view of recent data and the potential for continued high inflation results. To fully appreciate the relationship between bond yields and inflation, we must consider the components of a bond yield, and the forces which influence them.
Yield Components
The nominal yield on a credit risk-free U.S. Treasury security can be divided into two primary components:
- real yield (represents the expected growth of purchasing power), and
- inflation compensation (represents compensation for the expected loss of purchasing power).
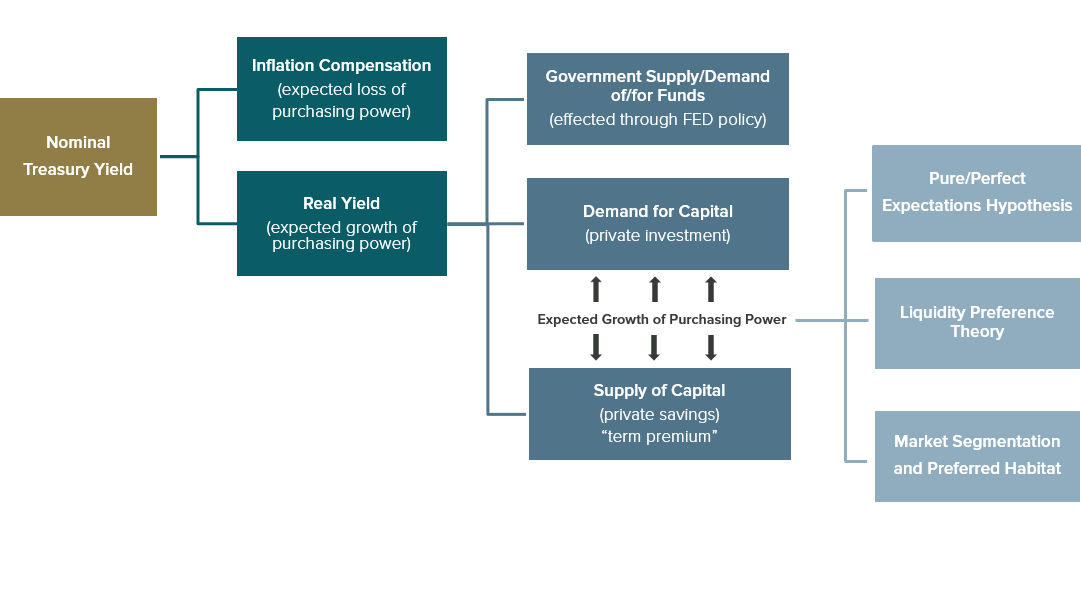
Real yield may seem an esoteric concept when defined by economic theory regarding the term structure of interest rates. In theory, the real yield for a given maturity length is a reflection of the equilibrium established between investment capital supply (lending) and demand (investment). In practice, we find the real yield is more akin to a combination of the expected level of the Federal Funds rate (as a base), and a yield premium which reflects the outlook for real (inflation adjusted) economic growth. Given the current positive outlook for the U.S. economy, it seems incongruous for real rates to be negative across the yield curve. However, excess liquidity created by Fed monetary policy coupled with strong foreign demand, appear to have overridden growth expectations. The following graph of the historic real yield on the 10-year Treasury note illustrates the relative rarity of negative real yields.
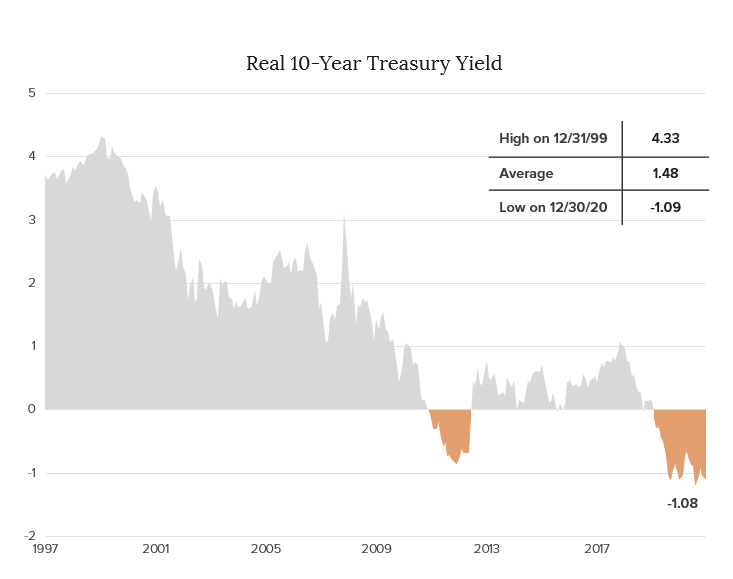
Source: Bloomberg (Data through: 11/30/2021)
The second component of the nominal Treasury yield is inflation compensation. It is important to note, inflation metrics, like CPI and PCE, reflect historical data, whereas the true influence of inflation on bond yields is prospective, in nature. The inflation compensation component of a Treasury security yield is represented by TIPs (Treasury Inflation Protected securities) “Breakevens,” which indicate the average annual expectation for inflation over a given time period. For example, a five-year breakeven yield of 3.00% indicates the expected average annual inflation rate over the next five years is 3.00%.
Adequate Compensation?
Having defined the components of a risk-free Treasury yield, we know a yield represents market expectations for future Fed policy, economic growth, and inflation. Judgment on whether the market is appropriately pricing-in enough yield to compensate for any of the aforementioned influences rests with the investor. However, a basis for approximating an appropriate level of yield compensation may be estimated by analyzing the relationships between those variables in a historical context.
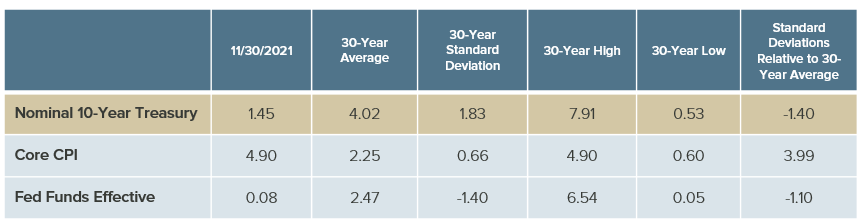
Source: Bloomberg (Data through: 11/30/2021)
For example, if the average difference over the past 30 years between the 10-year Treasury yield (dependent variable) and Fed Funds rate (independent variable) is ~1.55% (4.02% - 2.47%), and the current Fed Funds effective rate is ~0.08%, we can conclude a 10-year Treasury yield of 1.45% is reasonably close to its average relationship, and therefore within the margin of being fairly priced. We must also consider how the current environment is affecting the variables. For example, Core CPI has averaged 2.25% over the past 30 years, but the most recent level of 4.90% is 4 standard deviations above its 30-year average. This means for the 30-year period observed, 99.9% of the time we would likely see a Core CPI level lower than 4.90%, indicating the recent level is a rarity in the context of the past 30 years. Applying the same simple relational approach, we know the 10-year yield has averaged ~1.77% more than Core CPI over the past 30 years (4.02% - 2.25%). But given the recent statistically rare level of Core CPI, it would be unwise to assume the 10-year Treasury should be yielding 6.67% (4.90% CPI + 1.77%). Ultimately, historical relationships can provide a basis for estimating an appropriate yield level, but consideration must be given to statistics signaling an anomaly and the potential for secular change which can disrupt the relationship going forward.
Conclusion
The question facing bond investors is whether relatively low current nominal bond yields are appropriate given recent inflation results and future inflation expectations. We know current bond yields reflect inflation expectations through TIPs Breakevens as a component of the nominal yield. We also know recent inflation results are statistically rare, and consequently unhelpful in attempting to estimate yields based on historical relationships. An understanding of the influences on real yields, however, helps to formulate an explanation for the current level of nominal bond yields. Those influences include the expected Fed Funds rate, monetary system liquidity, and demand for Treasury securities. Comparing a historical Treasury yield relationship with an independent variable, like the Fed Funds rate, when both are experiencing roughly the same statistical relationship to their average, helps validate the current nominal yield level. What remains is the art of determining how long the forces which are currently pushing real yields to negative levels across the curve will prevail. The Fed Funds rate is one of the main influences on real rates and it appears interest rate policy is on the threshold of change.
Disclosures:
Crawford Investment Counsel Inc. (“Crawford”) is an independent investment adviser registered under the Investment Advisers Act of 1940, as amended. Registration does not imply a certain level of skill or training. More information about Crawford including our investment strategies and objectives can be found in our ADV Part 2, which is available upon request.
The opinions expressed are those of Crawford Investment Counsel Inc. Investment Team and are subject to change without notice. The opinions referenced are as of the date of publication, may be modified due to changes in the market or economic conditions, and may not necessarily come to pass. Forward looking statements cannot be guaranteed. Crawford Investment Counsel Inc. reserves the right to modify its current investment strategies and techniques based on changing market dynamics or client needs. There is no guarantee that Crawford Investment Counsel Inc.’s assessment of investments will be correct. The discussions, outlook, and viewpoints featured are not intended to be investment advice and do not take into account specific client investment objectives.
The 10-year Treasury Note is a debt obligation issued by the United States government with a maturity of 10 years upon initial issuance. A 10-year Treasury note pays interest at a fixed rate once every six months and pays the face value to the holder at maturity.
The Consumer Price Index (CPI) measures the change in prices paid by consumers for goods and services. The CPI reflects spending patterns for each of two population groups: all urban consumers and urban wage earners and clerical workers.
CRA-21-396

The Psychology of Inflation
We believe that the psychology of both inflation amongst consumers and wages amongst workers will be key determinants of future inflation.

Innovation & Transformation: Investing in AI
Given the pace of innovation and the rapid adoption of generative AI technologies, now is an exciting time to be an investor in companies with AI exposure. At Crawford, we can take advantage of these opportunities by identifying individual companies that both meet our quality requirements AND participate in these secular growth markets.

ESG Investing
There are a range of approaches that can be taken when it comes to developing a portfolio that incorporates both individual values and financial goals
