
It all began more than 25 years ago when two friends were discussing world affairs. The conversation eventually drifted to the investment arena as it normally did, since one was an avid collector of coins, antique rugs and other beautiful things, and one was a professional investor and founder of his own investment management firm. The collector, being of a keen mind and always one to propose something of interest, came up with an interesting idea. Having thought about the investment equation over the years and recognizing that bond (fixed income) yields at the time were attractive, he proposed the following. Looking over the long term, 25 years in this case, the collector would take a bird-in-the-hand approach by hypothetically investing in a U.S. Treasury zero coupon bond (Treasury strip) that would mature with a value of $1,000,000. A zero-coupon bond is a debt security that does not pay interest but instead trades at a deep discount, rendering a profit at maturity when the bond is redeemed for its full face value. Its yield-to-maturity of 7.25% would produce a perfect 7.25% compound return. The professional investor, on the other hand, would select five common stocks that hypothetically would be purchased and held for 25 years. The collector, a wordsmith, labeled the two approaches as “The Faith in Compound Interest” portfolio and “The Faith in Well Chosen Equities” portfolio.
The proper term to describe this would be “experiment,” but, in essence, this was a contest between bonds and stocks. Either way, it was to be a long-distance run to see how the $182,187.50 original investment in the Treasury strip, which we knew would produce a compounded return of 7.25% for 25 years, would fare against a portfolio of five equally weighted common stocks. With regard to the common stocks, there were several rules. There would be no trading; the original five would be held the full 25 years; and if one were acquired by another company the cash from the sale would be reinvested in equal amounts in the remaining four, or the stock of the purchasing company would come into the portfolio. All dividends would be reinvested, and no fees would be charged.
As described, this experiment would be long term, obviously, and would emphasize true investment in bonds and stocks. Since the bond was preselected as the benchmark, the investment advisor had to go to work to select the five common stocks. Survivability was of utmost importance, that is, would the companies survive for 25 years? Since dividends would be reinvested, they should in all likelihood be dividend-paying stocks. This was no problem since the investment advisor was a strong proponent of companies that not only paid dividends but also raised them almost every single year. His selections were Coca Cola, JP Morgan, Kellogg, Merck, and Procter & Gamble. All of these companies fell within the blue chip category and were expected to have businesses that had staying power for the long term.
The beginning yield on the common stocks was 2.27% (normalized for annual income since at the beginning all five did not pay in the six-week period from November 15 to December 31, 1993). This compared to the yield to maturity of 7.25% on the Treasury strip. Now the experiment has ended, and we can look at the results and perhaps learn something from what happened over 25 years of investment experience. Exhibits 1 and 2 reveal the results.
The following exhibits are from The Grand Experiment (“The Faith in Compound Interest” portfolio versus “The Faith in Well Chosen Equities” portfolio.) The Grand Experiment started at the end of 1993 and concluded in November 2018.
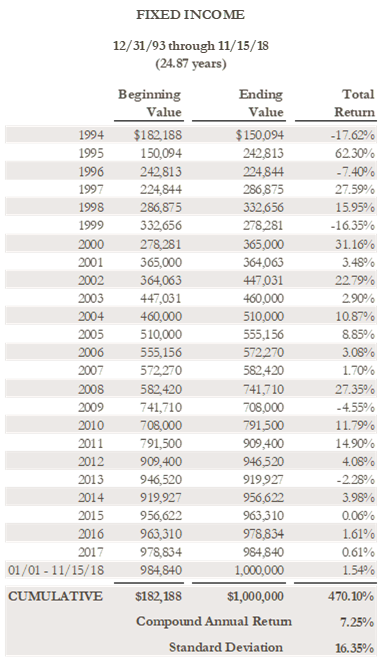
Exhibit 1: The Faith in Compound Interest Portfolio
Source: Crawford
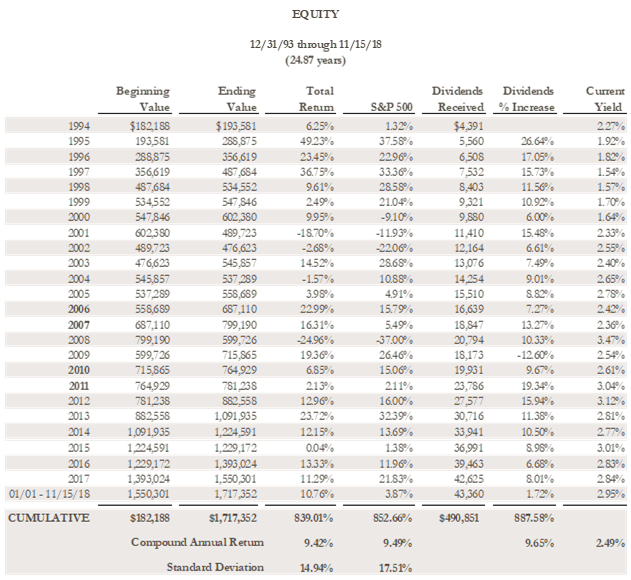
Exhibit 2: The Faith in Well Chosen Equities Portfolio
Source: Crawford
As it turns out, the results of the experiment confirm capital market theory: that over the long run, stocks should outperform bonds. This makes sense, considering there is an equity risk premium and using the proverbial corner grocery store as the object of investment. The owner (equity) of the grocery store should earn more than the lender (debt) to the store because the owner bears the risk and, as a result, deserves a higher return. The inestimable James Grant of Grant’s Interest Rate Observer explains it as follows:
Equities claim a natural edge over default-resistant bonds, the pro-stock argument goes, because the owners absorb greater risk than the creditors do. It’s inherent in the equity investor’s position at the bottom of the corporate capital structure. The senior claimants earn a contractual return—in the case of corporate securities, a priority call on cash flow or assets or both. The stockholders get what’s left over after the satisfaction of prior claims. Hence, the ‘equity risk premium,’ the ostensibly persistent increment of stock returns over those available on U.S. government securities. 1
Fortunately, the five stock selections did indeed have staying power, and as a result there were no changes in the stock list. While one would not wish to make sweeping conclusions about capital market actions based on a sample of five, nevertheless, the results are interesting and provide support for time-tested assumptions about investing.
A glance at the final tally indicates that, as expected, the $182,172.50 investment on January 1, 1994 in the U.S. Treasury strip matured on November 15, 2018 with the expected market value of $1,000,000, this the result of a pure compound rate of 7.25% per year. The equity portfolio finished with a market value of $1,717,351.50 with an excess return of $717,351.50 or a compound rate of 9.42% for the same period. Looking beyond these simple figures, let’s see what we might have learned from this experiment.
REAL RETURN MATTERS. It is nice to know the nominal return one has earned, but in the real world it is the real rate of return that matters. Using the Consumer Price Index, over the 25 year period of investment, inflation compounded at 2.2%. Subtracting this from the nominal return takes the real return on the equities to 7.26% and the fixed income to 5.02%. These still represent attractive returns that hold up very well against historical real returns over very long periods of time.
THE POWER OF COMPOUNDING. We learn an important lesson. It has to do with compounding and how what appears to be a small, incremental gain can result in a huge difference in actual dollars. The slightly greater than 2% return advantage of the equities over the bonds for 25 years resulted in a differential of some $717,000. Who would have thought that two percent would make such a difference? And, who would have thought that 9.42% per year would take $182,000 to $1,717,000? No less an economist than Albert Einstein labeled compounding as the eighth wonder of the world.
THE POWER OF DIVIDENDS AND REINVESTED DIVIDENDS. The investment advisor chose five stocks, all of which paid dividends and, perhaps more important, had a history of raising their dividends almost every year. This fact had an important bearing on the outcome of the experiment. Over the 25-year period, total dividends received were $490,831. In the first year, dividends amounted to $4,391. In the last year, dividends received were $50,675 (annualized due to the fact that the experiment ended on November 15, 2018, and two of the stocks were yet to pay their last dividends). This growth in dividends amounted to 9.65% per year, compounded. And is it more than coincidence that the compound rate of growth of the dividends was almost exactly the same as the total return of the portfolio? This supports the idea that dividends give value to stock, and as they increase they will tend to push the prices of stocks upward. One other interesting fact: the dividend yield in the first year was 2.27%, and at the end of the period it was 2.95%.
Dividends received increased every year but one: 2009. This was the result of the financial crisis and the imposition of TARP on JP Morgan which was forced to cut its dividend dramatically. JP Morgan began restoring its dividend in 2011 and has continued to raise it significantly since then. It is noteworthy that each of the other four stocks increased their dividends in each year of the experiment. This illustrates that exogenous events can have a disproportionate impact on certain areas of the economy or market. It also serves as a reminder that diversification is a virtue.
The reinvestment of dividends was a very important element in the outcome. Every single quarter, dividends were collected and reinvested in additional shares of the company. The result was that in the next quarter the dividend received was higher, even if the company did not increase the dividend. It was the combination of the companies’ raising their dividends every year (with the exception of JP Morgan) plus the reinvestment of the dividends that allowed the compound rate of growth in the dividends to be almost 10%. Such a rapid pace of dividend growth would not have been possible from dividend increases alone in five mature companies. Suffice it to say, the dividend pattern, both of rising payouts from the companies and the reinvestment of the dividends, was a major factor in the final outcome of the experiment. One last note on dividends: the $490,851 of total dividends received represented some 30% of the total investment return. Over even longer periods of time, dividends as a percentage of total returns is often higher, ranging up to 50%. The advent of stock buybacks probably has something to do with dividends’ providing a smaller percentage of total return more recently, as less money flows into dividends, thereby reducing their impact.
THE IMPORTANCE OF QUALITY. Each of the five equity names is considered to be of high quality. Quality can be defined in numerous ways, but we believe the most appropriate view of quality is the ability of a company to reduce the range of investment outcomes and provide investors with more confidence that, in fact, they will earn a return. This characteristic emanates from the stability of the underlying business and the ability of the company to consistently earn higher earnings and, in turn, consistently pay higher dividends. In the case of the five companies owned in the experiment, not only did their high quality help sustain them successfully over the 25-year period, but it did so through some very difficult economic and market environments. It is helpful to remember that during the 25-year period of the experiment there were two especially challenging periods. There was the dot com bubble in the stock market that led to the recession of 2000 and the housing collapse of the Great Recession of 2008-09, both of which produced 50% declines in the stock averages. Also, the economic recovery/expansion of the last nine years of the experiment was unusually slow. Of course there were many stock market corrections along the way, any one of which could have caused investors to panic and liquidate their stock holdings. In this experiment there was never the option of selling out, but in real life investing, owning stable, consistent, well capitalized and well managed companies that have demonstrated their staying power over many years by consistently paying and raising their dividends, helps one stay anchored and maintain holdings for the long run. Time and again it has been proven just how difficult it is to time the market. Better to select really good companies and stay invested for the long haul.
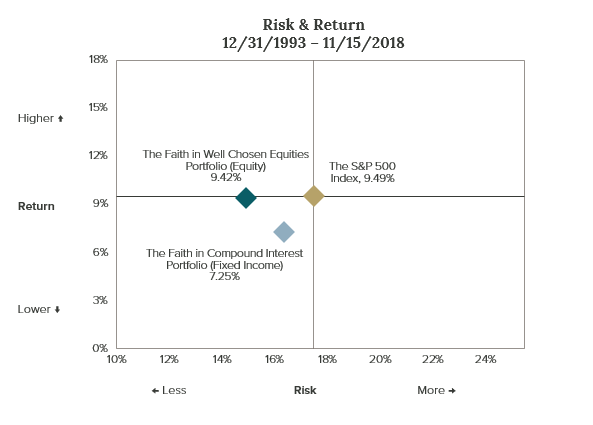
Quality also plays well in the area of capital preservation and downside protection. Note Exhibit 3 below which indicates return and risk. The compound return of the equity portfolio at 9.42% per year is essentially on target with the return of 9.49% for the S&P 500. But, the standard deviation of return at 14.92% is a full 15% less than the market, a remarkable feat in consideration of the fact that the equity portfolio was comprised of only five stocks. One would assume that such a concentrated portfolio would be much more volatile. Since standard deviation is considered to be one of the more effective ways of measuring risk, one way of looking at this is that the portfolio earned market returns with 15% less risk. This hearkens back to the importance of quality, since the stability that underlies businesses is the essential element in quality. Stable businesses produce stable earnings and dividends, characteristics that get translated into more stable stock prices over the long run. Comparable returns with lower risk are difficult to achieve. Interestingly, the bond return series has a high standard deviation, in large part because the Treasury strip pays no income. Dividend income is a quality harbinger, but further reduces risk or volatility because of the consistent positive return bias and regular cash flow.
Exhibit 3
Source: Crawford, eVestment
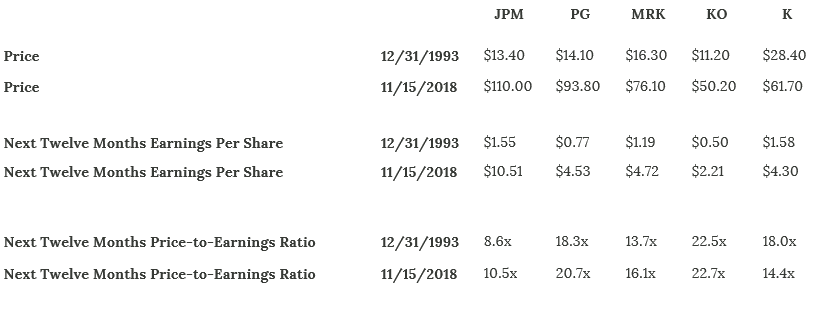
OBSERVATIONS ON THE STOCKS. Some might be interested in how the various stocks performed. See Exhibits 4 and 5 below.
Exhibit 4
Source: Crawford
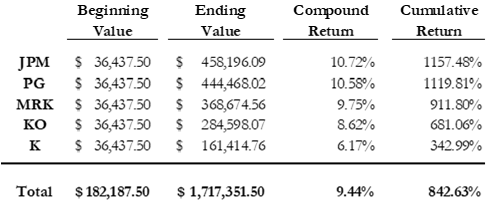
Exhibit 5
Source: Crawford, Factset
Over the full period, JP Morgan (JPM) and Procter & Gamble (PG) were the best performers by a substantial amount, followed by Merck (MRK), Coca Cola (KO), and Kellogg (K) in descending order. Only Kellogg failed to beat the 7.25% compound return of the Treasury strip. Interestingly, Procter & Gamble provided its shareholders with the most dividend income over the period as its dividend growth rate was superior. JP Morgan was a beneficiary of consolidation within the banking industry, increasing its relative position to one of dominance, benefitting as well from its balance sheet strength, diversified financial services profits, and generally higher-quality lending.
Exhibit 4 illustrates the change in price-to-earnings ratios for the five stocks over the full period. With the exception of Kellogg, all saw their price earnings ratios improve from the starting point, most notably JP Morgan, Procter & Gamble, and Merck. But, an average of the five stocks’ price-to-earnings ratios was only marginally higher than at the beginning. From this exercise one might conclude that it is more important to focus on the business rather than the valuation or price one has to pay, if the stock is to be held for a long time. In other words, in the end, we believe the quality of the business will win out.
CLOSING COMMENTS. The experiment supports the theory that equity investments should be superior to fixed income over the long term, even when interest rates and bond yields are high. It also demonstrates that well-chosen, high-quality companies can not only produce a higher return than fixed income but can produce one with less risk as measured by standard deviation. This is probably the strongest statement that can be made in support of quality as a characteristic. Speaking of well chosen, a tip of the hat is in order to the investor who chose the five stocks for the experiment. We have drawn generalizations about investment theory, but it is of course important to have the right investments, and in this case the stocks were indeed well chosen. The investor obviously had a bias toward consumer staple stocks as three of the five names are from that industry sector. He knew going in that it had been the highest returning sector when held over very long periods of time. Not too far behind was the pharmaceutical sector, which had also provided very satisfactory historical returns and enduring investment success. This should have come as no surprise since these two industry groups provided such stable earnings and dividends. A final note on stock selection: one does not have to own the “darlings” to do very well in the investment game. Notice the absence of technology, biotech, media, internet, or other exotic areas.
Some might say that even though the portfolio of stocks performed well, it did not produce above-average returns. It did not beat the market, no, but it essentially equaled the market, and with less risk, more dividend income, and substantially stronger-than-market performance in its worst single year (2008). And for most long-term investors, 9.42% is good enough. In the end, the outcome was favorable. Had the experiment been about seeking to beat the market, a different group of companies might have been chosen. In this case, a group of very high-quality, blue chip companies performed well.
CRAWFORD INVESTMENT COUNSEL. How does this experiment and the subsequent results relate to what we do at Crawford Investment Counsel? With a broad focus on quality, our firm’s investment philosophy appreciates the power of compounding and harnesses the potential of dividends. We invest in quality businesses with asset strength, business consistency, management acumen, and we seek to benefit from their forceful and growing dividend policies. While equities are our asset class of preference, we believe the best approach for many investors often includes a mix of both stocks and high-quality bonds.
We believe long-term investors should emphasize stocks but can own both categories in a complimentary fashion, allocating various percentages to each based on individual circumstances and conditions in the capital markets. Bonds mitigate risk, so this asset category can help smooth out the ride, provides the investor with the ability to remain invested, and dovetails with Crawford’s overall balanced portfolio strategy. We take comfort in the results of this experiment and keep faith in our approach moving forward. And the gentleman who chose the five stocks? None other than the Founder of Crawford Investment Counsel and its investment philosophy, John H. Crawford, III.
Please reference our related Podcast for more detail:
Disclosures:
Crawford Investment Counsel Inc. (“Crawford”) is an independent investment adviser registered under the Investment Advisers Act of 1940, as amended. Registration does not imply a certain level of skill or training. More information about Crawford including our investment strategies and objectives can be found in our ADV Part 2, which is available upon request.
The opinions expressed are those of Crawford Investment Counsel Inc. Investment Team and are subject to change without notice. The opinions referenced are as of the date of publication, may be modified due to changes in the market or economic conditions, and may not necessarily come to pass. Forward looking statements cannot be guaranteed. Crawford Investment Counsel Inc. reserves the right to modify its current investment strategies and techniques based on changing market dynamics or client needs. There is no guarantee that Crawford Investment Counsel Inc.’s assessment of investments will be correct. The discussions, outlook, and viewpoints featured are not intended to be investment advice and do not take into account specific client investment objectives.
The S&P500 Index is the Standard & Poor's Composite Index and is widely regarded as a single gauge of large cap U.S. equities. It is market cap weighted and includes 500 leading companies, capturing approximately 80% coverage of available market capitalization.
CRA-21-393

Where Did the Bond Vigilantes Go?
In the face of extremes, the bond market remains surprisingly calm. Given these circumstances, one might ask, “Where did the bond vigilantes go?”

Innovation & Transformation: Investing in AI
Given the pace of innovation and the rapid adoption of generative AI technologies, now is an exciting time to be an investor in companies with AI exposure. At Crawford, we can take advantage of these opportunities by identifying individual companies that both meet our quality requirements AND participate in these secular growth markets.

Top Ten Investment Lessons Learned
I was recently asked to give a brief presentation on an investment-related topic. What follows is my list of the top ten lessons I have learned throughout my years of working as both a portfolio manager and analyst.
