
Active investment managers seek alpha, which is the component of the Capital Asset Pricing Model (CAPM) that indicates outperformance relative to an index. The CAPM equation rests on the idea that higher risk, or more volatile (measured through beta) investments, should provide higher returns over time. While this is not necessarily the case, it is the basis on which many investors value stocks and attempt to explain the relationship between risk and return. Alpha has become shorthand for “beating the market,” and the difficulty of achieving this has led many to pursue a passive investment approach. We will spare you the specifics of the CAPM equation, but suffice it to say that it can be utilized to help evaluate an investment strategy’s relative, risk-adjusted performance. The two primary components of the CAPM equation are alpha or “value-added” and beta or “volatility.” This formula enables a comparison of results on a risk equivalent basis.
At Crawford Investment Counsel, the strong historical alpha of our Dividend Growth strategy is a direct result of our low historical beta (or risk level). An intended result of our consistently applied process is the delivery of both low volatility and protection on the downside. Through narrowing the range of outcomes, we improve the chances for success, tend to mitigate the likelihood of adverse returns, and enhance the return pattern. Over time, these factors work together to produce alpha. Our Dividend Growth strategy has a 40-year track record of success and positive alpha generation. By looking at this strategy’s behavior in relation to the market over this 40-year period, we can begin to understand the value added by our low volatility investing approach.
Figure 1
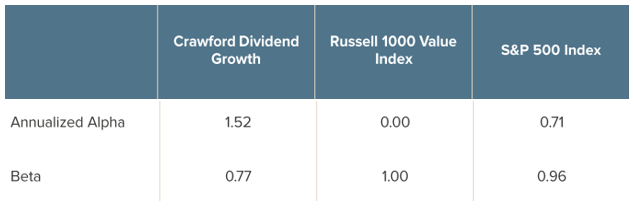
Source: Crawford, eVestment
Since Inception 1/1/1981 and through 9/30/2021. Data is shown net of fees. Data is shown is comparative to the strategy’s stated benchmark, the Russell 1000 Value Index, as well as the S&P 500 Index. The data above is shown as supplemental information to the Dividend Growth GIPS Composite Report.
At Crawford, in the interest of narrowing the range of outcomes, we invest only in the companies that we believe have the greatest chances of success. For us, these are high-quality companies: high conviction, stable, and growing businesses. We use a company’s dividend history as an initial indicator of quality, because we believe that a business’s ability to pay, sustain, and grow its dividend over time is often indicative of business stability and financial strength. In more specific terms, a company’s dividend history might signal consistent cash flow generation, low earnings variability, strong balance sheets, and shareholder-friendly capital allocation policies. It is for this reason that the Crawford Dividend Growth strategy invests only in companies with ten years of stable-to-rising dividends. Dividend history defines the strategy’s initial investment universe, which is further refined into a monitored candidate pool that is constructed using primarily fundamental research, in addition to proprietary qualitative and quantitative screening.
The statistics in Figure 1 indicate that Crawford has achieved positive alpha over time. That is, the strategy has provided superior results to what one would expect, given the risk assumed and overall market returns.
Figure 2
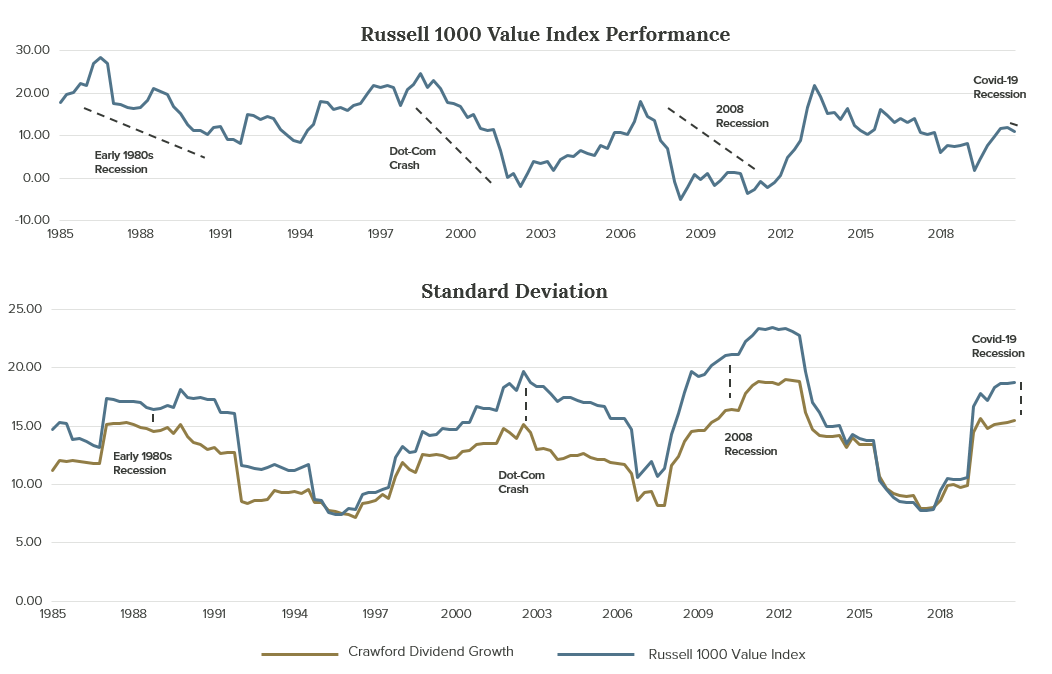
Source: Crawford, eVestment
Computed using rolling 5-Year annualized quarterly returns and standard deviation from 1/1/1981 through 9/30/2021 (roll back frequency: 1 quarter). Data is shown net of fees. Data shown is comparative to the strategy’s stated benchmark, the Russell 1000 Value Index. The data above is shown as supplemental information to the Dividend Growth GIPS Composite Report.
Figure 2 illustrates the Crawford Dividend Growth strategy’s standard deviation in relation to its primary benchmark, the Russell 1000 Value Index (below), along with the index performance (above). The standard deviation and performance are displayed in rolling five-year periods. We chose this period because we believe it is short enough to demonstrate short-term market movements, but long enough to demonstrate that a traditional investment program or manager can get into trouble when market returns are declining and/or negative. It is in these times that the merits of our approach are realized.
Standard deviation is another measure of volatility, and the chart is meant to indicate that in periods of market stress, investing in higher quality lowers overall volatility in relation to the market. As you can see, when market volatility is high, the strategy’s volatility is significantly lower than that of the market. However, when market volatility is low, the strategy’s volatility is often on par with that of the market. This is why we believe our strategy delivers on “quality when you need it most.”
What Figure 2 doesn’t show you is that not only does investing in quality mitigate risk in the event of a downturn, but it also empowers upside participation to enable long-term outperformance. Everybody knows the market goes up more than it goes down, but our strategy’s long-term outperformance is most frequently realized in the periods of market stress. This is further indicated by Figure 2, which illustrates two of the most recent and memorable declines, along with Crawford’s outperformance when market returns were negative.
Figure 3
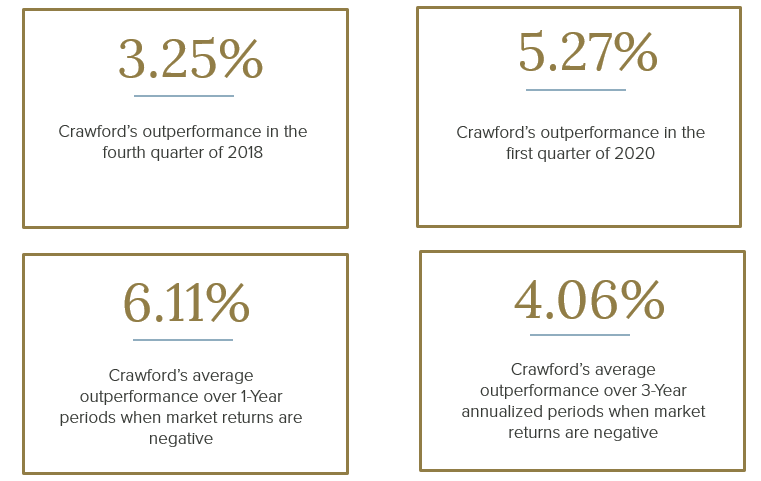
Source: Crawford, eVestment
Up and down markets are based on the quarterly returns of the S&P 500 Index. 3-Year annualized performance computed using rolling 3-Year annualized quarterly statistics from 1/1/1981 through 9/30/2021 (roll back frequency: 1 quarter). Data shown is net of fees. Outperformance statistics are computed in relation to the strategy’s stated benchmark, the Russell 1000 Value Index. The composite returns are shown as supplemental information to the Dividend Growth GIPS Composite Report.
We go forward with great confidence in the belief that our focus on high-quality companies insulates our investors from much of the volatility typically associated with investing, empowering outperformance in periods of market stress. We continue to believe the merits of our low volatility investment approach will be realized through long-term, positive alpha generation.
Disclosures:
Crawford Investment Counsel Inc. (“Crawford”) is an independent investment adviser registered under the Investment Advisers Act of 1940, as amended. Registration does not imply a certain level of skill or training. More information about Crawford including our investment strategies and objectives can be found in our ADV Part 2, which is available upon request.
The opinions expressed are those of Crawford Investment Counsel Inc. Investment Team and are subject to change without notice. The opinions referenced are as of the date of publication, may be modified due to changes in the market or economic conditions, and may not necessarily come to pass. Forward looking statements cannot be guaranteed. Crawford Investment Counsel Inc. reserves the right to modify its current investment strategies and techniques based on changing market dynamics or client needs. There is no guarantee that Crawford Investment Counsel Inc.’s assessment of investments will be correct. The discussions, outlook, and viewpoints featured are not intended to be investment advice and do not take into account specific client investment objectives.
The S&P500 Index is the Standard & Poor's Composite Index and is widely regarded as a single gauge of large cap U.S. equities. It is market cap weighted and includes 500 leading companies, capturing approximately 80% coverage of available market capitalization.
The Russell 1000 Value Index measures the performance of the large cap value segment of the U.S. equity universe. It includes those Russell 1000Ò Index companies with lower price-to-book ratios and lower expected growth values.
CRA-21-393

An Attractive In-Plan Income Solution
For 401(k) participants seeking income, we believe the Crawford Managed Income Strategy is an attractive solution.

Neutralizing Interest Rate Sensitivity
Given the potential for rising interest rates in the year ahead, the Crawford Managed Income Strategy is a compelling option for 401k participants.

The Golden Opportunity: Crawford Small Cap Strategy
We came to realize that the small cap area of the market might actually be the best place to reap the benefits of our long-held philosophy.
