
We live in unusual times, economically speaking. The National Bureau of Economic Research (NBER) is the entity charged with the responsibility of dating economic cycles. Recently, they declared the recession of 2020 to have ended in April 2020, just two months after its beginning in February 2020. This makes it the shortest recession on record. Since 1857 there have been 34 economic cycles of varying durations, so the fact that this was the shortest makes it unusual, indeed. It also seems odd that only now has it become evident that the recession ended some 16 months ago. The NBER has their own way of doing things.
The chart below, which goes back to the 1970s, provides interesting information to contemplate.
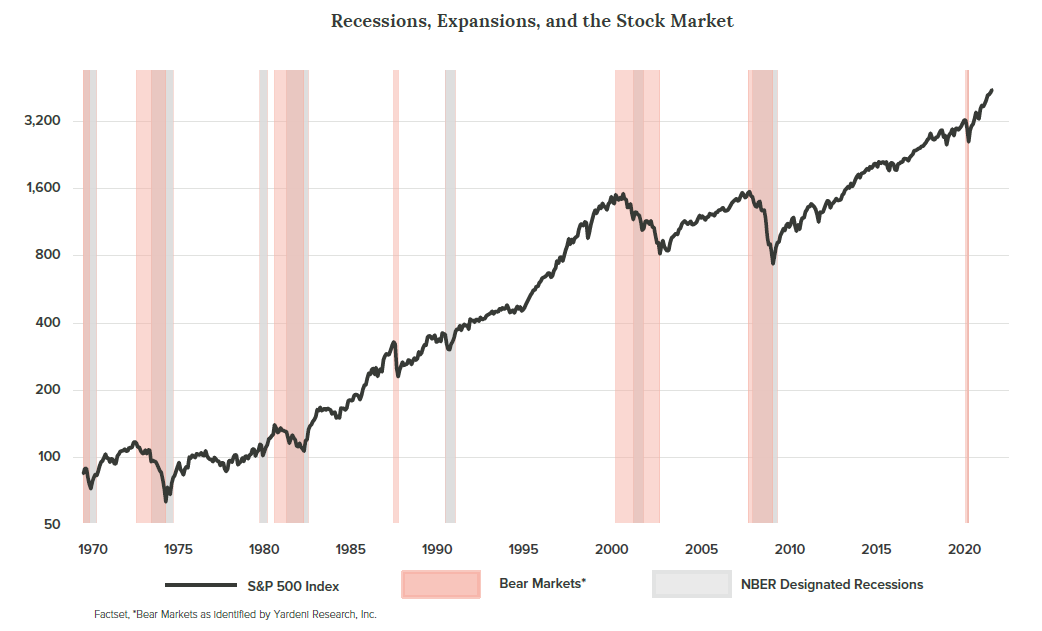
FREQUENCY AND DURATION OF RECESSIONS. The gray vertical lines denote periods of recession. There have been seven recessions since 1970. A quick view of the chart reveals that recessions rarely fall close to the previous one, with the exception of those of 1980 and 1981. On average, these recessions have occurred every six or seven years. Notice that there was a ten-year gap between the recession of the early 1990s and early 2000s, and then the longest gap ever, eleven years from 2009 to 2020. The simple truth is, it is good news when recessions end, for what is likely to follow is an extended period when the economy is in a recovering and expanding mode. Since we find ourselves only 16 months into the new recovery/expansion cycle, it is likely that the next recession lies some distance in the future. We should have a favorable economic period in place for a while.
A word of explanation on the term “recovery/expansion” is in order. We often use this term to describe the full cycle of economic activity from its trough (the end of the recession) to the end of the expansion/beginning of the next recession. Recovery refers to the period when the economy is recovering the ground lost during a recession, that is, its return to the level of economic output at the start of the recession. Once this level of economic activity is achieved, expansion begins and lasts until the beginning of the next recession, hence a cycle of “recovery/expansion.”
THE STOCK MARKET IN RECESSIONS AND RECOVERY/EXPANSIONS. This is the fun part. We have overlaid the recessions with the action of the stock market. In this instance we use the S&P 500 as a proxy for stocks. The first thing to notice is the nice upward sweep of the market since 1970. Over the last 50 years the stock market has provided a compound annual return of 10.94%. Don’t gloss over that figure; it is very impressive. More specifically, the stock market line is advancing consistently during all periods in between recessions because the economy is recovering or expanding, and a growing economy is almost always good for companies and their earnings. Advancing earnings is probably the single most important driver of stock returns. As earning improve, stocks are worth more.
All investors know that stock investing is not a one-way street. Stocks are always subject to temporary corrections and, even worse, to bear markets in which the decline in the market is 20% or more. The chart confirms that in each instance of recession we have experienced significant declines in stocks. Does this suggest that investors should try to predict recessions and sell out in advance? We do not advise this. Experience tells us that recessions are never predictable events as they are usually caused by fundamental factors accumulating under the surface, that is, they are not apparent. They are often caused by Federal Reserve (Fed) policy which raises interest rates to cure an inflation problem, and in the process goes too far and causes a contraction in economic activity. Again, this is very difficult to discern.
Investors would be well served to compare the amount of damage done to stocks during a recession to the long periods of upward movement between recessions. The good far outweighs the bad. The average annual compound returns from stocks in all seven recessions is -7.74%. Contrast that to the average annual compound return between recessions of 19.12%. Even more importantly, the long upward trend in stocks is what one does not want to miss out on. Trying to time the market is the best way to miss out. The act of getting out at the right time and getting back in at the right time is almost impossible to accomplish. A better approach is to commit to the stock market and stay there.
WHAT NEXT? We have just stated that predicting recessions is not easy, and we must apply the same to predicting the future after a recession. However, we do know that history is on our side. Typically, recessions have been followed by longer periods of expanding economic activity and rising stock markets. We expect this to be the case in the aftermath of the most recent recession. We are only 16 months into the recovery/expansion cycle and expect that we have at least a few more years to go in this cycle. In fact, we believe we may be in the early stages of an extended cycle. We are hoping, and believe there are solid reasons to expect, that this upcycle can resemble the previous one that lasted longer than any in history.
We have written about our expectation of a return to what we call the “2% world,” an economy whose growth, inflation and interest rates tend to center around 2%. These were the conditions that produced the eleven-year cycle that was interrupted by the Covid pandemic. After adjustment to reopening and achieving normalcy again, we believe there is a good chance that these conditions will return. We are firmest in our belief that growth will eventually center on the 2% range. The real key is inflation. If it stabilizes at somewhere around 2% then interest rates should stay low, and the package of low growth accompanied by low inflation and interest rates will once again be a favorable one for stock investors.
CONCLUSION. Stock investors should take notice. The path of economic activity has been on an upward trajectory for a very long time. Its progress is temporarily interrupted by recessions, but it has always recovered and progressed to higher levels of output. Standards of living have increased. This has provided an attractive environment for companies to compete in, leading to expanding earnings and dividends over long periods. The key for stock investors has been to notice these trends and get aboard. Long-term investing is the best way to let the power of compounding work on one’s behalf. Buy good companies—what we call high quality—companies with staying power, and catch the upward draft. Our economic and market system is not without flaws, but on balance it works and has been a wealth-creating machine. Investors should trust it and enjoy the benefits.
We don’t wish to make it sound too easy. Stock investors have had to endure a number of difficult events over the last fifty years: the stagflation of the 1970s, sky-high interest rates in 1980, the crash of 1987, the bursting of the dot com bubble, 9/11/2001, the Great Financial Crisis, and the pandemic. Yet, through it all, corporate America has been able to push their earnings and dividends ever higher. The reward to stock investors has been great. Future returns? Again, this is unpredictable, but we choose to give high quality stocks a chance, and we believe the results will be satisfying.
Disclosures:
Crawford Investment Counsel Inc. (“Crawford”) is an independent investment adviser registered under the Investment Advisers Act of 1940, as amended. Registration does not imply a certain level of skill or training. More information about Crawford including our investment strategies and objectives can be found in our ADV Part 2, which is available upon request.
This material is distributed for informational purposes only. The opinions expressed are those of Crawford. The opinions referenced are as of the date of publication and are subject to change due to changes in the market or economic conditions and may not necessarily come to pass.
Forward looking statements cannot be guaranteed. This document may contain certain information that constitutes “forward-looking statements” which can be identified by the use of forward-looking terminology such as “may,” “expect,” “will,” “hope,” “forecast,” “intend,” “target,” “believe,” and/or comparable terminology. No assurance, representation, or warranty is made by any person that any of Crawford’s assumptions, expectations, objectives, and/or goals will be achieved. Nothing contained in this document may be relied upon as a guarantee, promise, assurance, or representation as to the future.
CRA-21-203

What’s up with GameStop?
Anyone with even a passing interest in the stock market is aware of the GameStop saga that is going on in the market.

Britain's Minsky Moment
On September 28, the Bank of England (BoE) backstopped the gilt market, the British government debt market equivalent to the United States Treasury market.

The Uncertainty of Investment Returns
As a stock market investor, there are few guarantees. However, we believe if one has a well thought out discipline and remains invested, suitable results follow.
