
Our current theme is Watching and Waiting. However, watching and waiting is not passive. As the Federal Reserve has increased rates as a means to combat inflation, we have been purposefully and deliberately analyzing stocks, checking our theses, and where necessary, repositioning portfolios. One of the areas where our equity research team is most focused is on the strength of corporate balance sheets.
Before explaining why we scrutinize balance sheets, some background is important.
Every quarter, companies with publicly traded equity on U.S. exchanges have to file financial disclosure statements in a document called a 10-Q or a 10-K. While these documents may seem tedious, the 10-Q/K is a central component to understanding the investment worthiness of a company. The three primary financial statements are the income statement, the statement of cash flows, and the balance sheet. The income statement is most widely cited, especially by popular financial media, as it details revenue, operating profit growth, margins, and earnings per share. The cash flow statement is also popular, specifically around valuation metrics such as free cash flow yield.
The balance sheet is a snapshot at a single point in time showing the financial position of a company. It shows all of the company’s assets (items owned by or owed to the company) offset by the liabilities (items the company owes to others) and shareholders’ equity (capital paid into the company). While a balance sheet shows only one moment in time, analyzing several balance sheets from successive periods becomes very helpful in tracking investing criteria, especially solvency and return metrics.
So why are balance sheets important to us? The financial health of a company, especially the margin of safety for continued operations, is taken from the balance sheet. Companies with higher levels of cash, lower levels of debt, and higher levels of working capital, are better positioned to be stable in times of financial downturns. The Portfolio Strategy team at Goldman Sachs recently demonstrated this quite convincingly with a study, summed up in the following graph. Please note the gray vertical bars indicate recessionary periods.
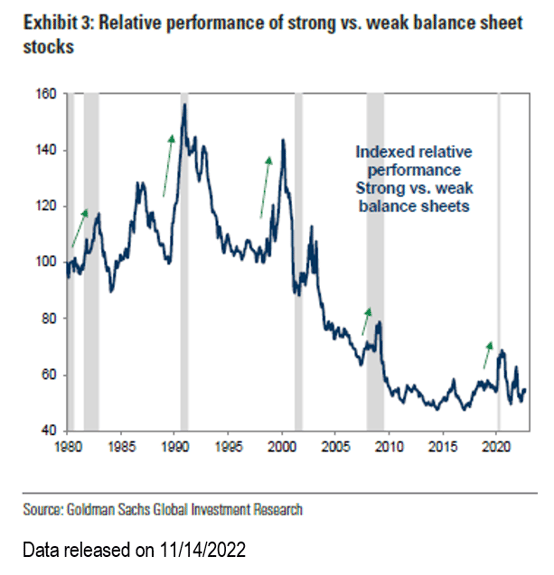
Over the last forty years, as the equity markets prepared for recession or were in a recession, companies with stronger balance sheets tended to outperform. The Goldman study used a metric called an Altman Z-score, which is a complex financial formula that uses almost all aspects of the balance sheet in conjunction with some income statement metrics to gauge financial flexibility. As a caveat, Altman Z-score is not a useful metric for banks, utilities, and REITs, so it is not universal. The Goldman study went on to classify the companies in the S&P 500 (table below) and noticed that “3” was typically the cut-off for concern in companies.
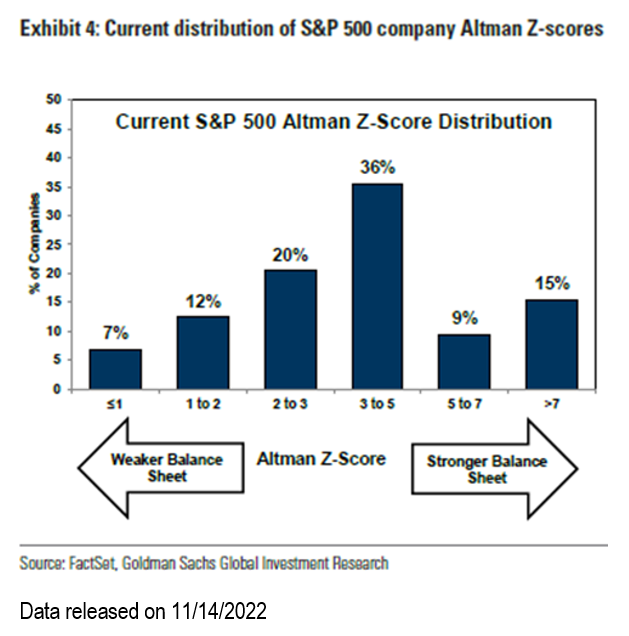
Our own analysis shows that in our large capitalization portfolios ~75% of applicable companies fall in the categories of stronger balance sheets (i.e. Altman Z-score of 3+). Most of the companies that have a score below 3 are in sectors that typically carry greater debt owing to consistent cash flows (such as Telecom and Transaction Processors) or have recently completed an acquisition and are in the process of using excess cash to deleverage and strengthen their balance sheet. Suffice it to say we are comfortable but not complacent with the overall leverage profile of portfolio constituents.
Let’s take the long-held Johnson and Johnson (J&J) as a specific example. The company has issued debt consistently over the last 30 years, totaling $32 billion, but was particularly active over the last decade, issuing $25 billion in debt. The company is actually underleveraged compared to its estimated $21 billion in free cash flow last year (2022). J&J’s balance sheet has an average interest expense of 3.0%, which is below the current Federal Funds overnight rate and the 2-year Treasury rate, both about 4.3%. More impressive is the value created for shareholders, as the $25 billion in debt issued over the last decade has an average rate of only 2.22%. Rarely are companies in a position where short-term investment opportunities for cash are more profitable than retiring long-term debt. Management’s foresight to pursue aggressive restructuring of the balance sheet puts the company in a position of increased flexibility for using its cash to grow the business through research and development or acquisitions, all while paying a healthy and rising dividend.
As we make adjustments to our portfolios entering 2023, our bias will be to “trade-up” on balance sheet strength, preferring companies with excess free cash flow, lower levels of debt, greater cash holdings, and more favorable terms for converting sales into cash (cash conversion cycle). These moves should help buttress portfolios against the possibility of a recession in the next year owing to the actions by the Federal Reserve in 2022. We view stronger balance sheets at this point in the economic cycle as very supportive of our longer-term focus of investing in what we believe to be high-quality, dividend-paying stocks. So, while we characterize the current environment as one where we are “watching and waiting,” please know we are re-underwriting the investments owned with the emphasis on strong balance sheets that are more likely to allow companies to continue paying a dividend, even in a potential downturn.
Disclosures:
Crawford Investment Counsel (“Crawford”) is an independent investment adviser registered under the Investment Advisers Act of 1940, as amended. Registration does not imply a certain level of skill or training. More information about Crawford, including our investment strategies, fees, and objectives, can be found in our Form ADV Part 2and/or Form CRS, which is available upon request.
The opinions expressed are those of Crawford. The opinions referenced are as of the date of the commentary and are subject to change, without notice, due to changes in the market or economic conditions and may not necessarily come to pass. There is no guarantee of the future performance of any Crawford portfolio. Crawford reserves the right to modify its current investment strategies and techniques based on changing market dynamics or client needs.
The company identified herein is an example of a holding and is subject to change without notice. This company has been selected to help illustrate the investment process described herein. A complete list of holdings is available upon request. This information should not be considered a recommendation to purchase or sell any particular security. It should not be assumed that any of the companies listed have been or will be profitable, or that investment recommendations or decisions we make in the future will be profitable
CRA-23-002

Origins: Crawford Dividend Growth Strategy
The old saying, “necessity is the motherhood of invention” is a good way of introducing the story of the origin of the Dividend Growth strategy.

Terrible Economy Surging Stock Market
The last four months have presented investors with a situation unlike any other in the history of the U.S. economy and stock market

Stocks: Rent, Own, or Just Stay in a Hotel?
If owning a stock with a six-month time horizon is analogous to renting, then options contracts can be compared to staying in a hotel.
