
We’ve previously written that our Total Shareholder Return (TSR) framework is an effective way to define our internal expectations for components of investment return from a particular stock. This methodology outlines total investment return expectations through identifying and analyzing the specific sources of potential return from earnings growth, valuation changes, and dividend yield. (Read more about how we employ our proprietary TSR framework at the stock-specific level here.)
While we don’t explicitly forecast shorter-term market returns as part of our research process, we find that our TSR convention can be applied to various segments of the stock market to estimate longer-term return expectations (3+ years). We submit that attempting to estimate stock market returns over one-year periods is very difficult, but stepping back and looking at things through a longer-term lens improves our chances of success.
Over longer periods of time, earnings growth is typically the largest component of investment return for the stock market, assuming returns are positive. Utilizing a three-year time horizon, our formula breaks out sales growth, margin expansion, and share repurchases/debt repayment to arrive at the overall expected Earnings Per Share (EPS) growth rate of the business. This tends to work particularly well when applied to our higher-quality investment profile since, when compared to more cyclically-oriented, lower-quality businesses, the returns from our portfolios are typically more consistent and thus more readily predictable. We believe that investing in companies with more consistent earnings patterns improves our odds of success, while also producing above-average or above-benchmark dividend yield. In sum, investing in higher quality, more consistent, and more predictable businesses provides an added element of certainty as it relates to the return component, enabling investors to take on less risk and benefit from the dividend.
Given that through the end of 2021, the overall market compounded at a very attractive rate over the short and longer-term, we thought that defining our expectations for each component of the overall stock market’s TSR might be helpful in gauging future expected returns. Not only does this help frame our expectations over what we believe to be an appropriate time horizon, it also gives us a baseline to compare our individual holdings against. We can also glean helpful insight into the judgements other investors are making relative to valuations and growth.
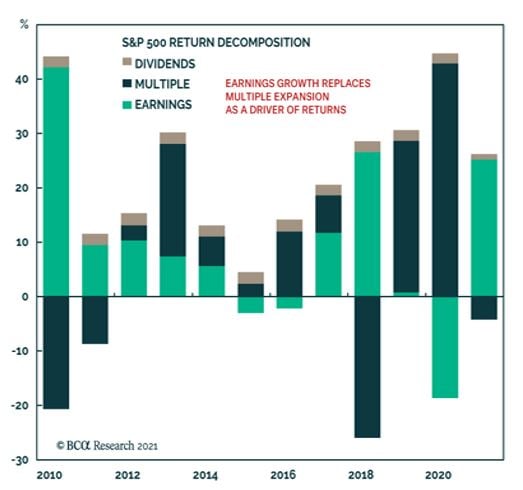
First, it is informative to illustrate the various components of recent annual historical return from the market (S&P 500), courtesy of the Bank Credit Analyst (BCA). Note that in 2019 and 2020, most of the market return came from valuation expansion, while earnings were down over the 24-month period that encompassed the recession. Last year, earnings were actually up more than the overall stock market, meaning the P/E multiple actually shrunk in 2021. This is fairly typical in years when earnings are up big, such as 2010 and 2018.
This brings us to today and our TSR outlook for the various market benchmarks that roughly represent the returns of a particular segment of the market, or the popular stock averages. The dividend yield is the easiest component to predict since we know exactly what this figure is today, and it is often the most stable component of investment return. Unfortunately, over the short-term, it is often the smallest component of market return, as well. Also, with the run-up in stock prices, and in part because interest rates are so low, dividend yields remain low. We do not expect this component to provide tremendous return contribution, but we note what we believe to be an important feature: the dividend yield is always positive.
Earnings and valuation changes can be either positive or negative, and often they move in the same direction, exacerbating trends in the market and economy. The valuation changes are more difficult to predict, and here we apply a conservative approach. Given current interest rates and P/E multiples, we think it unreasonable to expect higher valuations over the intermediate term, and we would not be surprised to see this metric actually decline. Under this assumption, earnings growth will need to do the lion’s share of generating future stock returns. While we are comfortable making this assumption, we have trouble forming expectations greater than mid-high single digits over a 3-5 year horizon, given a more modest backdrop for overall economic growth, very high profit margins, and a likely increase in both interest rates and corporate tax rates.
The chart below outlines our TSR expectations for the various segments of the stock market.
Total Shareholder Return Expectations, based on Crawford equity research team estimates, with applicable ranges:
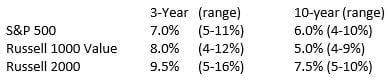
We will offer some observations and clarifications about the table above. First, the ranges represent the disparity of individual equity research team member inputs. The differential is largely a function of whether an economic recession occurs within the time frame and at what point in the time frame it occurs. This represents the degree to which economic downturns can impact earnings patterns and ultimately, investment returns. Generally, the range of expectations narrows as time frame extends, illustrating reinforcing our aforementioned point that longer-term return forecasting is typically more accurate. Short-term fluctuations, which are almost all related to changes in valuation, represent the hardest variable to predict.
Under our methodology, stock returns will most likely be more modest over the next few years than they have been in the more recent past. We believe our consistently applied investment approach provides a higher level of visibility and a lower level of volatility within the individual securities in our portfolios. Typically, the relative returns (compared to market averages) of our strategies are stronger in more modest return environments. We are encouraged by the potential for the companies which make up our portfolios to grow earnings and dividends while also appreciating over time, working favorably for our investors. Going forward and given our market projections, we maintain our focus on high-quality securities and hold a great degree of conviction in our investment approach.
Disclosures:
Crawford Investment Counsel (“Crawford”) is an independent investment adviser registered under the Investment Advisers Act of 1940, as amended. Registration does not imply a certain level of skill or training. More information about Crawford Investment Counsel, including our investment strategies, fees and objectives, can be found in our Form ADV Part 2, which is available upon request.
There is no guarantee of the future performance of any Crawford portfolio. This material is not financial advice or an offer to sell any product.
Crawford reserves the right to modify its current investment strategies and techniques based on changing market dynamics or client needs.
The investment strategy or strategies discussed may not be suitable for all investors. Investors must make their own decisions based on their specific investment objectives and financial circumstances.
CRA-22-077

The Total Shareholder Return Trifecta
We invest to achieve an investment trifecta by selecting stocks that provide our investors with all three components of total investment return: fundamental business progress or growth, dividend yield, and valuation improvement

The Pilgrimage to Omaha
Following these six basic principles has been good for Warren Buffett, it has been good for us, and we believe loyalty to those principles will be good for you.
Terminal Value: A Lesson in Asymmetry
We believe that at the forefront of any investor’s mind should be both the threat of principal erosion or permanent loss of capital and the significance of the pattern of their investment returns.
