In this piece, we take key points from our firm's most recent Bond Policy Meeting and share them with our readers. Hopefully, this piece will provide some insight into the economy and fixed income markets and give you a sense of how our team is thinking about recent trends and developments.
Crawford Bond Policy
- The latest Fed pivot became reality on September 17th with a 25-basis point cut driven by a shift in focus to the full employment side of their dual mandate.
- Chairman Powell flagged the change in focus away from inflation being the predominant policy driver during his Jackson Hole speech in August.
- By referring to inflation as remaining elevated and the rate cut as a “risk management” move, it is fair to infer policy is not on a pre-set course and the balance of risks between labor and inflation will inform decision making on a meeting-to-meeting basis.
- We continue to believe we are in the same rate and economic cycle. Fed rate policy still appears to be mildly restrictive and labor market strength has deteriorated.
- Given the importance of consumption representing ~70% of the U.S. economy, we are watchful for signs that employment weakness develops into a consumption downturn.
- Consequently, we will continue to maintain our defensive positioning, including an above benchmark allocation to defensive corporate industry sectors, agency, and municipal credits.
- We will also continue to manage yield curve positioning and consequent duration toward the longer/higher end of our intermediate range for potential performance upside as the cycle progresses.
- Our philosophy continues to drive our investment process. We believe bonds represent our client’s safest liquid investment assets and are intended for principal preservation and income production.
- We approach strategy management from a defensive point of view because bonds are meant to play defense in a portfolio paired with equities as offense.
- As investors, we find ourselves at a point in the economic cycle when positioning defensively in terms of sector weights and credit cyclicality is crucial for achieving the primary objectives of bond investing.
Treasury Yields as of 9/17/2025
- U.S. Treasury security yields fell across the curve between the July and September Fed meetings.
- Movement was led by declines in real yields reflecting the increased likelihood of the Fed resuming rate policy easing, and the threat of a weakened economic outlook driven by a softer employment picture influencing future consumption.
- Inflation expectations, as reflected in TIPs Breakevens, fell modestly despite higher reported goods and services inflation due to the widely held interpretation that higher inflation data has been driven by tariff effects which are believed to be transitory.
- Employment data through the month of August confirmed a continued pattern of weakening conditions. The full employment side of the Fed mandate is now taking precedence over the 2% inflation goal in setting policy.
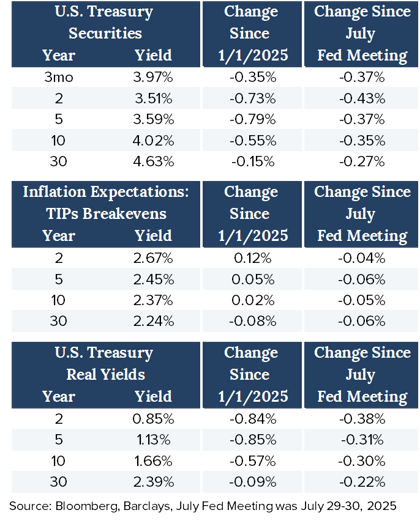
- Longer-term Treasury yields (5-years and beyond) reflect a combination of what the market expects Fed rate policy to be in the future, how that policy will impact the balance between inflation and growth, and expectations regarding fiscal policy and debt management.
- The longer the maturity, the more the yield is influenced by the market’s interpretation of the future impacts of monetary and fiscal policy.
- This year, the 30-year Treasury yield has remained elevated relative to shorter-term yields as term premium (yield compensation for inflation and fiscal management unknowns) has remained elevated and rangebound, while the increased likelihood of the Fed resuming policy easing played a larger influence on shorter securities.
- In early September longer-term yields began to fall as the market gained confidence in the Feds ability to maintain a slow, disciplined approach to policy easing. Additional support for lower yields came from the interpretation of elevated CPI being tariff-driven and transitory.
- The yield curve is likely to remain steep for the remainder of this cycle, even as interest rates fall in reaction to Fed policy. This is primarily attributable to fiscal policy.
- The market demands term premium for the unknown, particularly when it comes to debt and deficit management.
- Early next year, the U.S. Supreme Court is expected to rule on the ability of the administration to impose tariffs through emergency powers. If it rules against the ability to use those powers, it could negatively impact the deficit and push long-term interest rates higher.
- Additionally, supply impacts from reduced immigration, tariffs, and political pressure exerted on the Fed help make the case for a steeper yield curve moving forward.
Investment Grade Corporate Bond Market
- Investment grade corporate bond spreads (yield compensation for credit risk) remain very compressed, particularly in view of the elevated probability for recession.
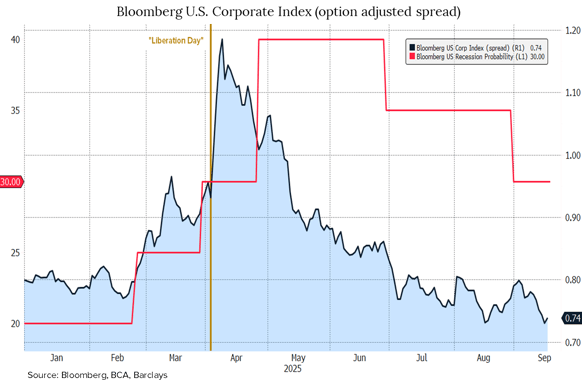
- Technical Support for Spreads:
- Relatively low year-to-date new issuance net of maturities/calls/coupons.
- Significant year-to-date investor ETF inflows.
- New issue metrics demonstrate strong investor demand (and limited need for additional yield compensation to attract interest.
- Fundamental Support for Spreads:
- Investment grade corporate credit metrics demonstrated further improvement in the second quarter.
- While spreads currently have technical and fundamental support, continued upside (compression) from the current 0.74 level seems limited based on a 35-year average of 1.29, and low of 0.53. Any meaningful negative disruption to the “soft landing” scenario of steady employment and economic expansion would likely push spreads wider (higher).
Municipal Bond Market
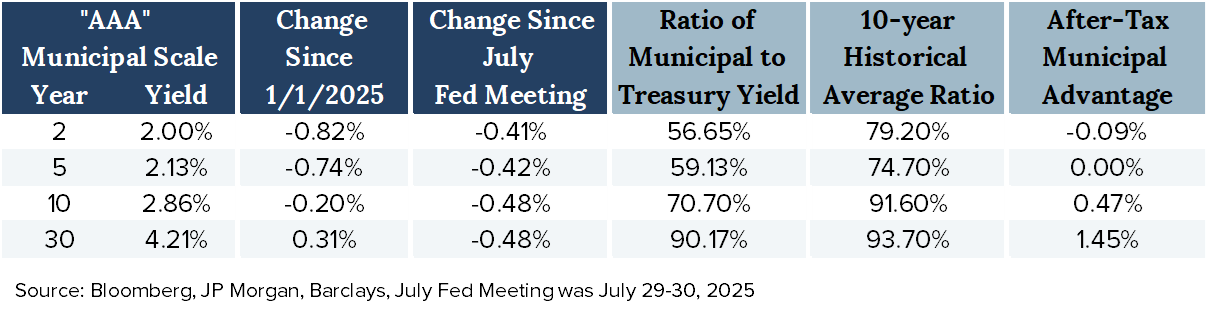
- Municipal bond yields fell evenly across the curve between the July and September Fed meetings.
- Most of the move lower occurred over the first half of September supported by a reduction in the record level of new issue supply digested year-to-date through August, and the growing likelihood of the Fed resuming the easing cycle in rates.
- From a relative value standpoint, the entire municipal curve is trading below 10-year average ratios based on generic “AAA” municipal scale yields relative to U.S. Treasury yields.
- This is particularly pronounced in shorter maturities where the after-tax yield advantage versus Treasury yields is breakeven or negative.
- Technical pressure on the municipal market has been unrelenting this year due to record new issue supply.
- Even normal calendar patterns, including positive summer performance driven by redemptions outracing supply, did not occur this year.
- In fact, some municipal market indexes recorded negative total returns for the month of July for the first time since the Taper Tantrum of 2013.
- The surge in new issuance is attributable in part to a 37% increase in public construction spending over the past five years against increased costs as Core CPI climbed ~ 23%.
- Additionally, there was a pull-forward in issuance over the first half of the year to avoid any potential negative ramifications to municipal exemption from the “One Big Beautiful Bill Act.”
- From a fundamental perspective, tax revenue-based sectors continue to benefit from the underlying strength of the U.S. economy.
- Caution is warranted, however, and the need to be selective with sectors and specific credits is increasing as positive credit rating momentum may be turning over.
- Moody’s reports their municipal downgrades exceeded upgrades in the second quarter for the first time since the fourth quarter of 2020, breaking a 17-quarter streak of upgrades exceeding downgrades.
- Absolute yields, particularly on the longer end of the maturity spectrum, continue to attract investors as evidenced by continued strong mutual fund and ETF inflows.
- Banks and insurance companies are still able to find relative value on a tax-equivalent basis in longer-term securities versus similarly rated corporate bonds.
- Combined, this retail and institutional demand should continue to support the market into year-end.
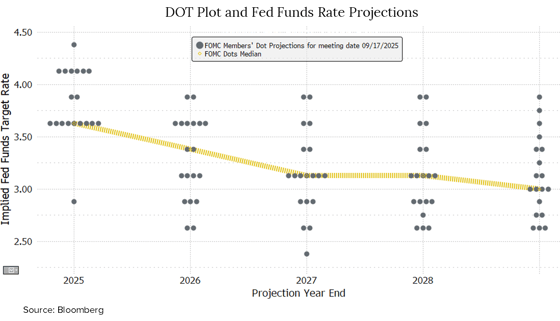
DOT Plot and Summary of Economic Projections (SEP)
- Median economic projections improved in the SEP with increased Real GDP forecasts in 2025, 2026, and 2027, and lower unemployment in 2026 and 2027.
- Inflation expectations moved modestly higher for 2026.
- One interpretation of the change in projections is increased Fed optimism regarding the ability to “soft land” the economy with an expectation for slightly higher inflation temporarily resulting from tariff effects.
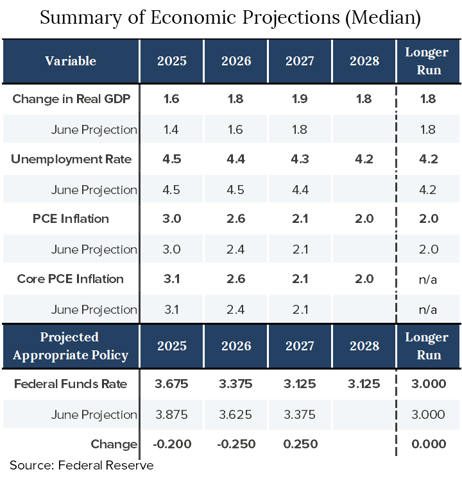
- The median DOT projections for 2025, 2026, and 2027 rate policy skewed “dovish” relative to June forecasts with the pace of cuts increasing, but the ultimate destination the same.
- In summary, 10 members expect two or more cuts this year, and 9 expect one or fewer cuts.
Disclosures:
Crawford Investment Counsel (“Crawford”) is an independent investment adviser registered under the Investment Advisers Act of 1940, as amended. Registration does not imply a certain level of skill or training. More information about Crawford, including our investment strategies, fees, and objectives, can be found in our Form ADV Part 2and/or Form CRS, which is available upon request.
The opinions expressed are those of Crawford. The opinions referenced are as of the date of the commentary and are subject to change, without notice, due to changes in the market or economic conditions and may not necessarily come to pass. There is no guarantee of the future performance of any Crawford portfolio. Crawford reserves the right to modify its current investment strategies and techniques based on changing market dynamics or client needs.
Material presented has been derived from sources considered to be reliable, but the accuracy and completeness cannot be guaranteed.
CRA-2509-5

Crawford Bond Policy Update
Crawford's bond policy reflects the firm's stance on the fixed income markets, interest rates, inflation, and more.

September Bond Policy Update
Crawford's bond policy reflects the firm's stance on the fixed income markets, interest rates, inflation, and more.

November Bond Policy Update
Crawford's bond policy reflects the firm's stance on the fixed income markets, interest rates, inflation, and more.
